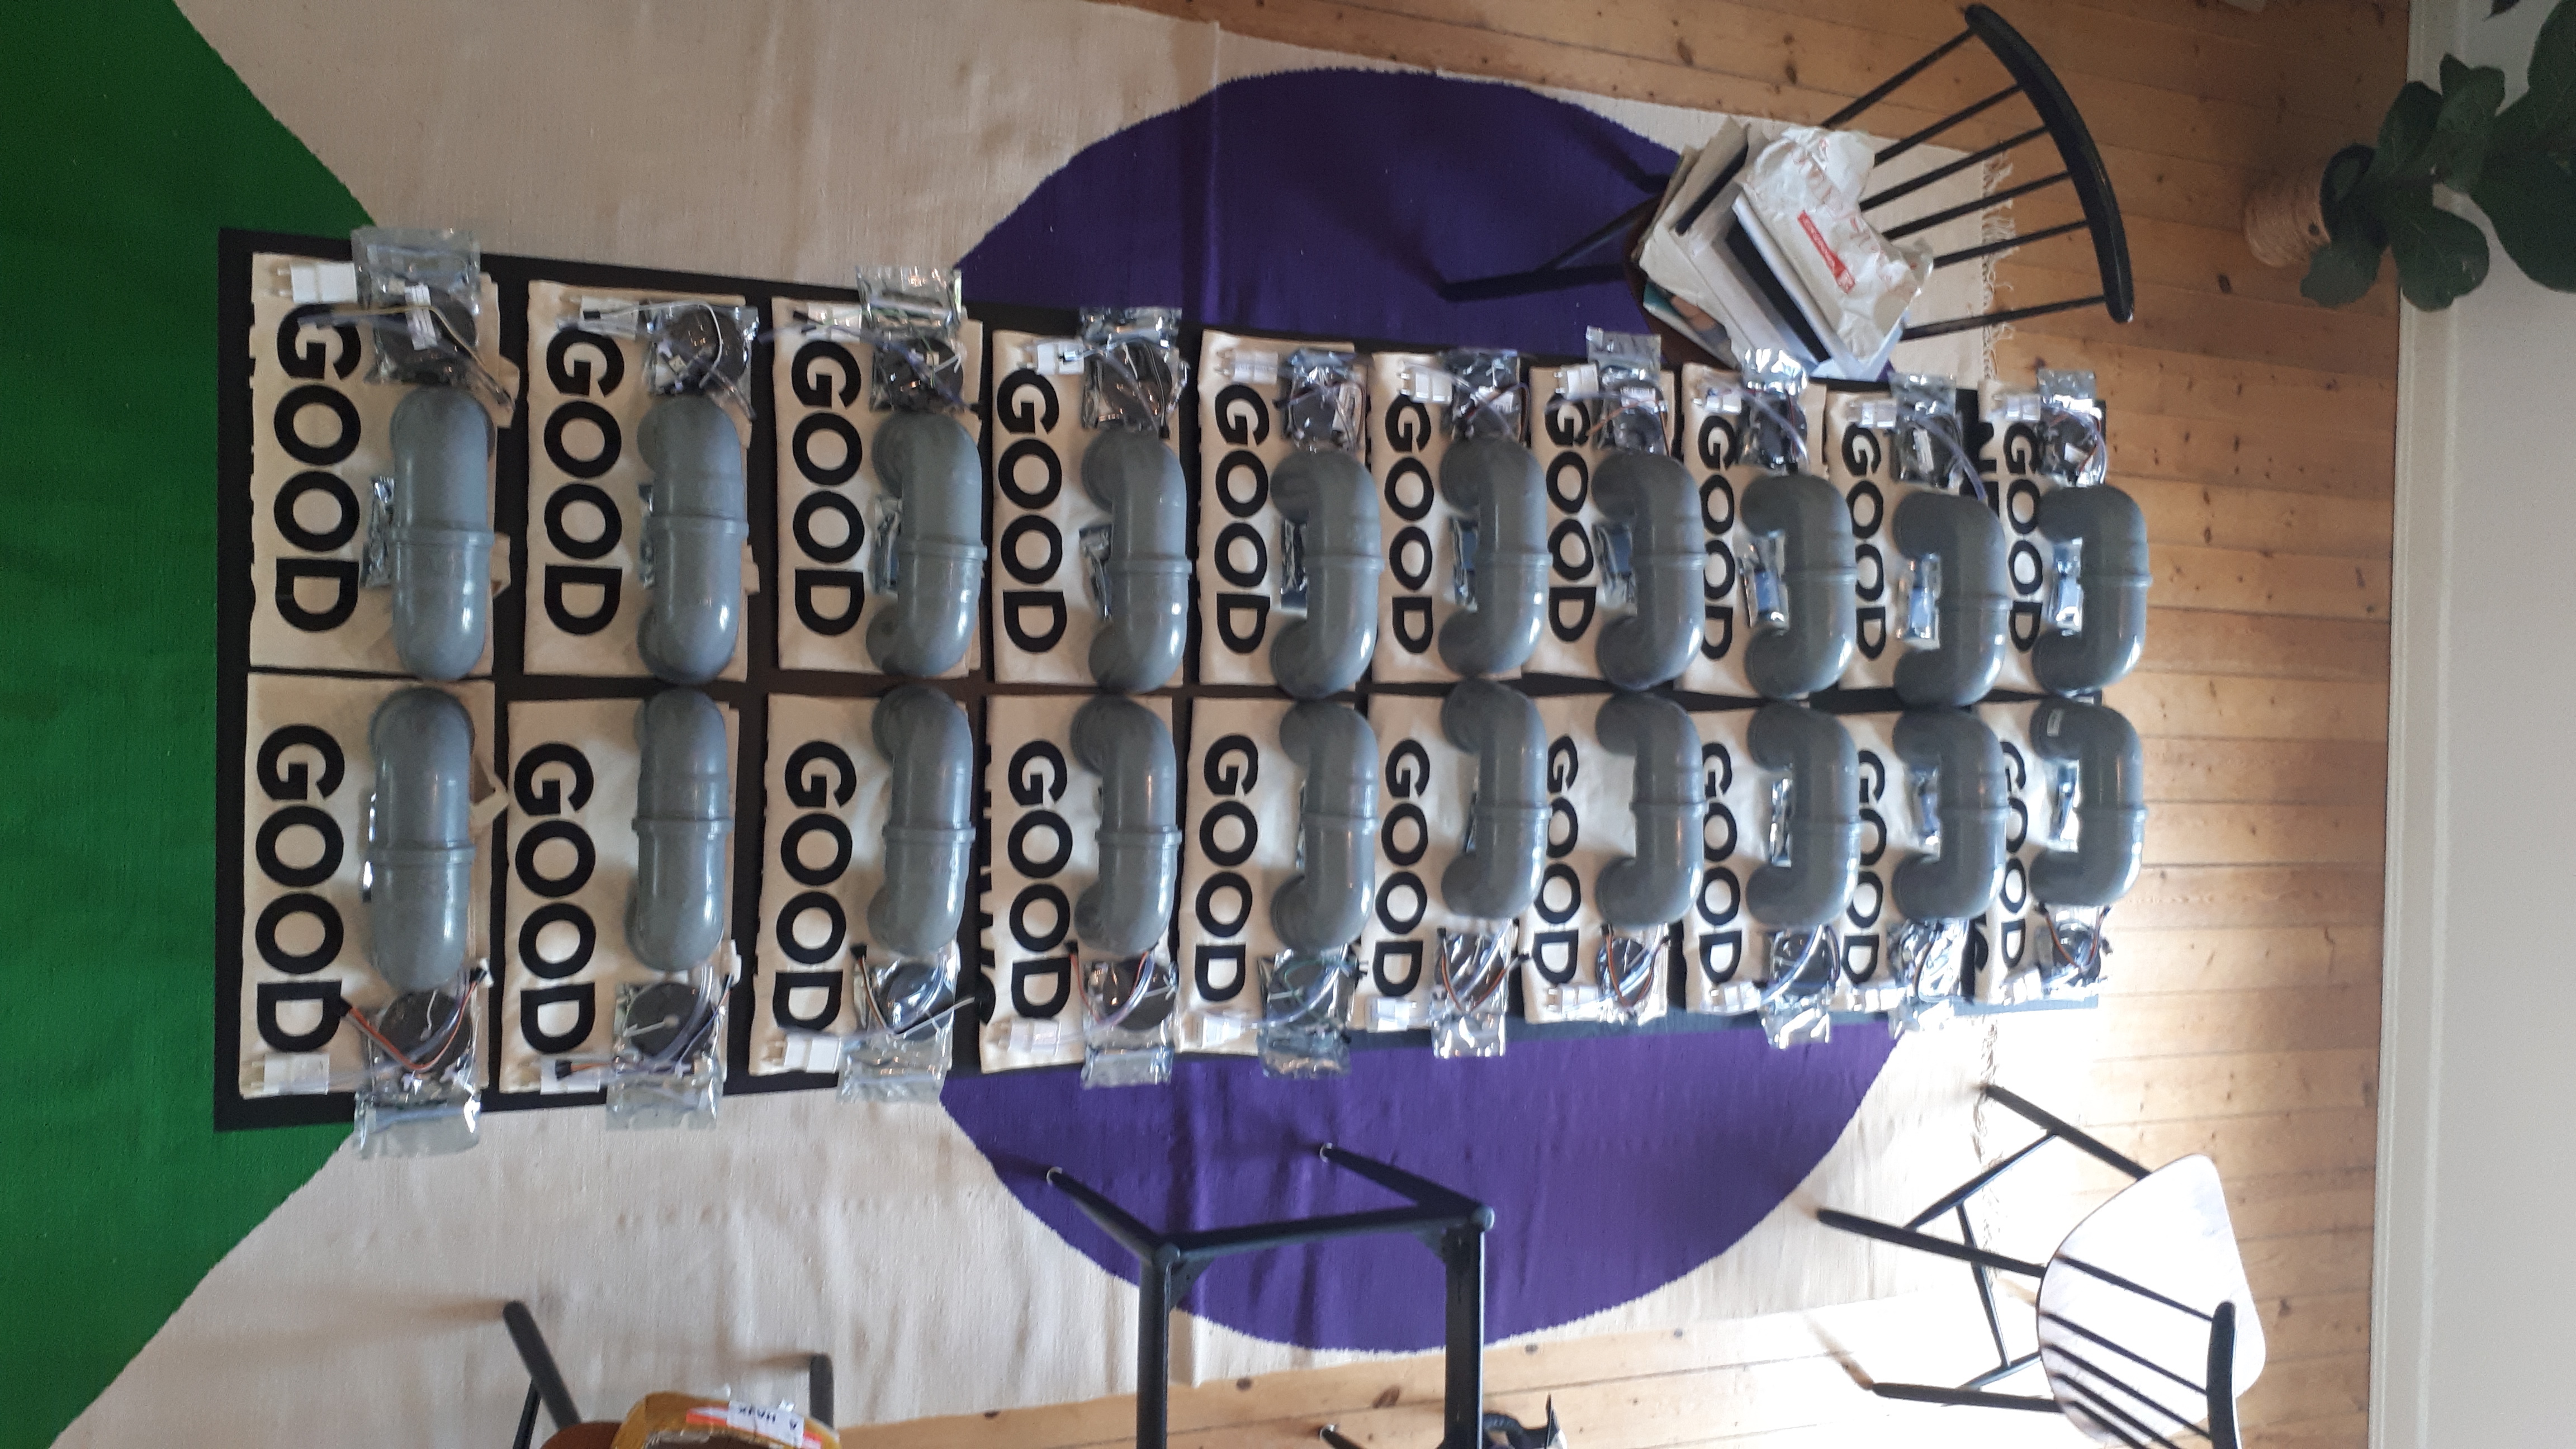
Airrohr Workshop
20 new finedust sensors with Zeit Online

20 new finedust sensors with Zeit Online
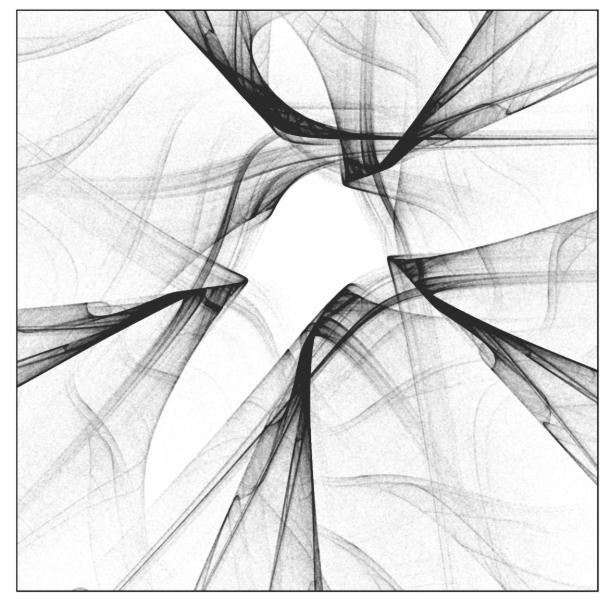
Playing around with @aschinchon strange attractor algorithm
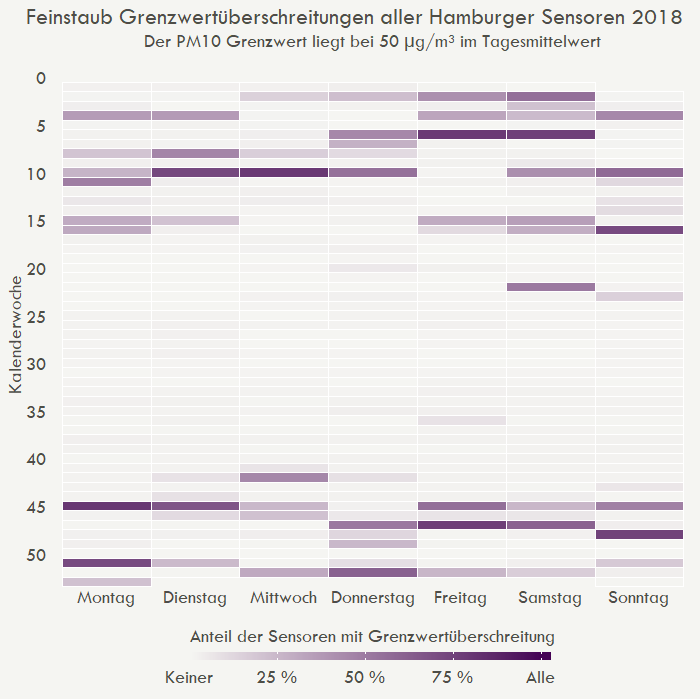
Analysis and Viz of Finedust Sensor Data from Hamburg 2018
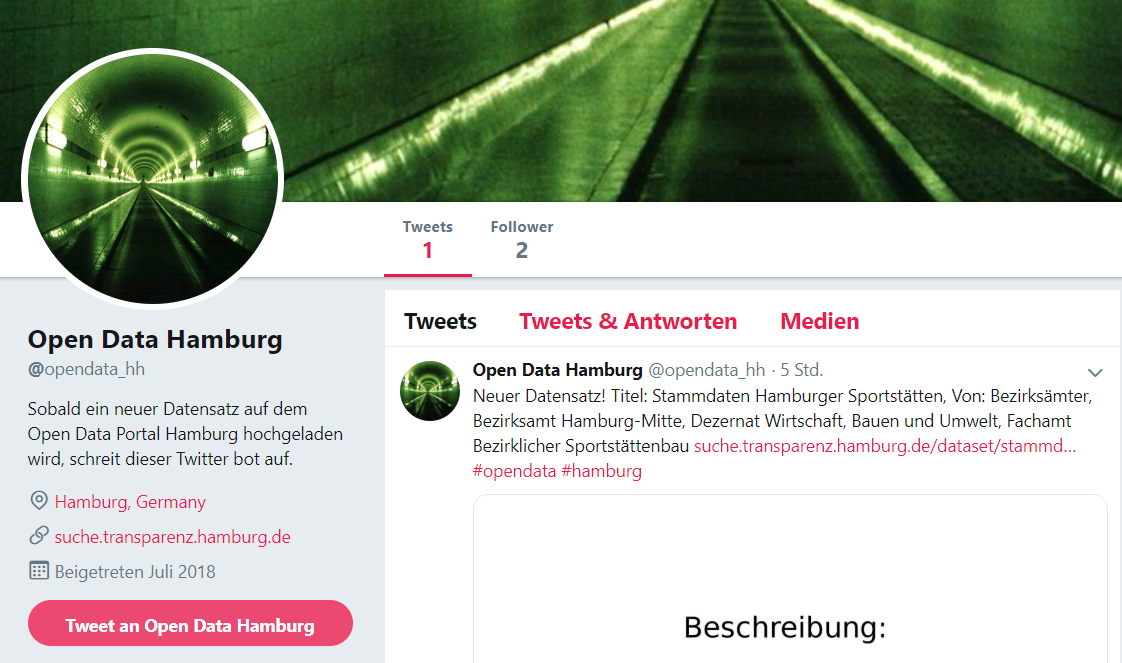
A twitter bot that informs about new data sets on the open data portal of Hamburg

Projects I have worked on during my Google Fellowship with Spiegel Online

Twitter analysis of Netzwerk Recherche’s annual conference 2018

Animated visualization of the Hamburg Marathon 2018
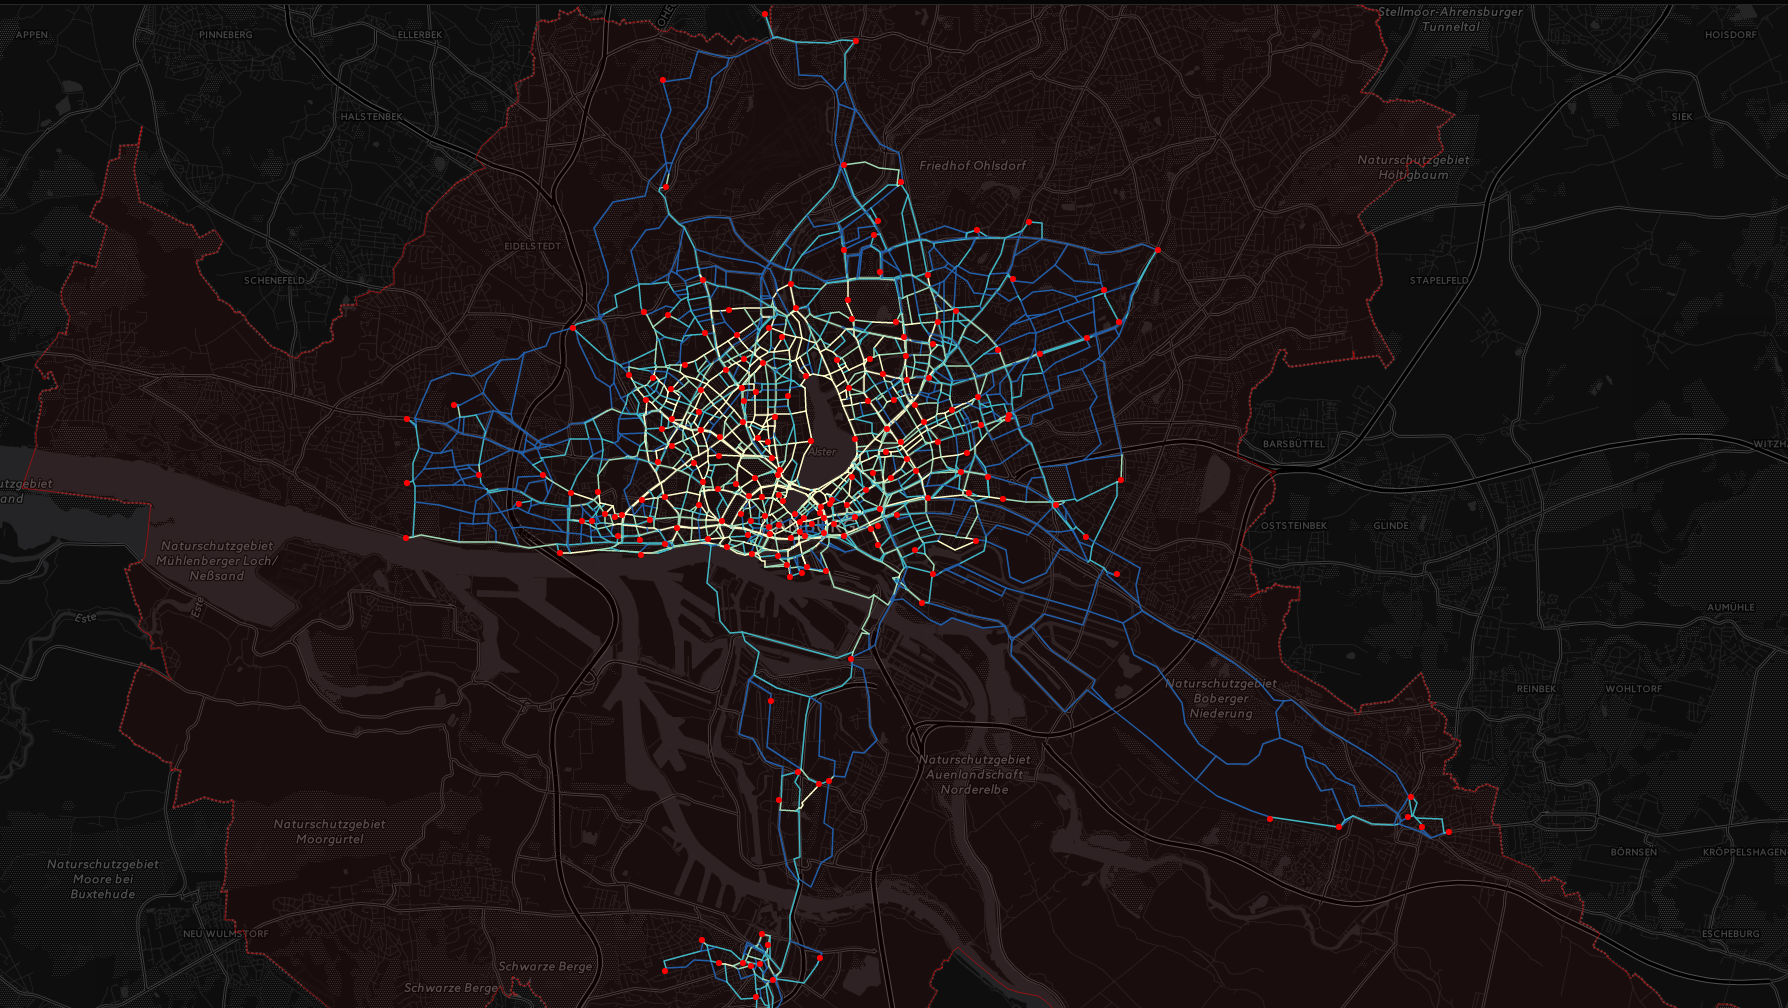
Interactive map of bike sharing in Hamburg
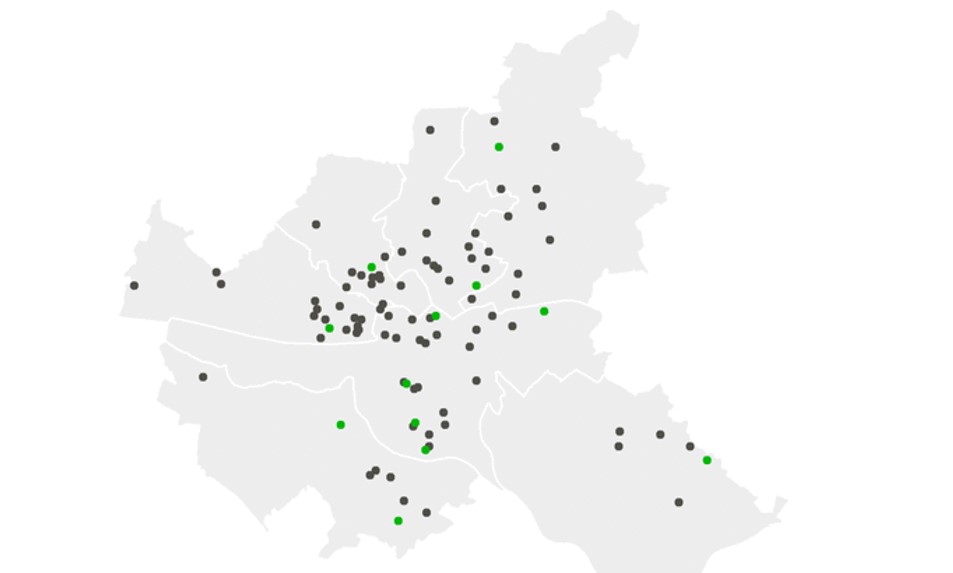
Animated visualizations to show the current state of the airrohr project.
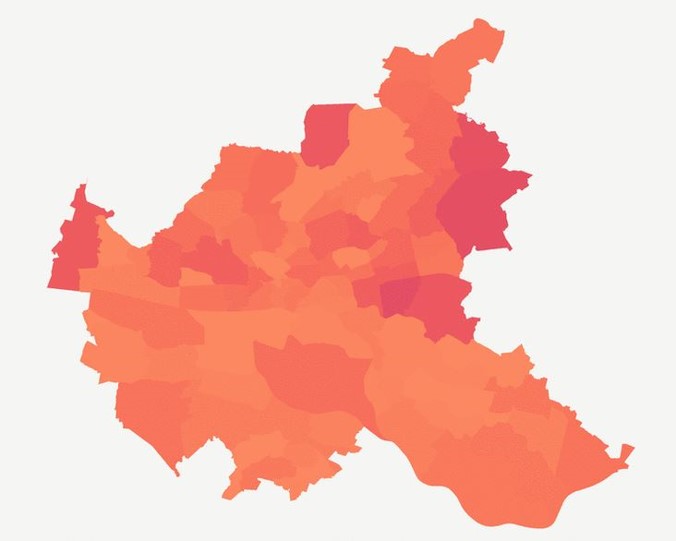
Animated visualization of street tree plantings in Hamburg

Predict the category of a dish’s cuisine given a list of its ingredients
How to visualize the Results of a Cluster Analysis?
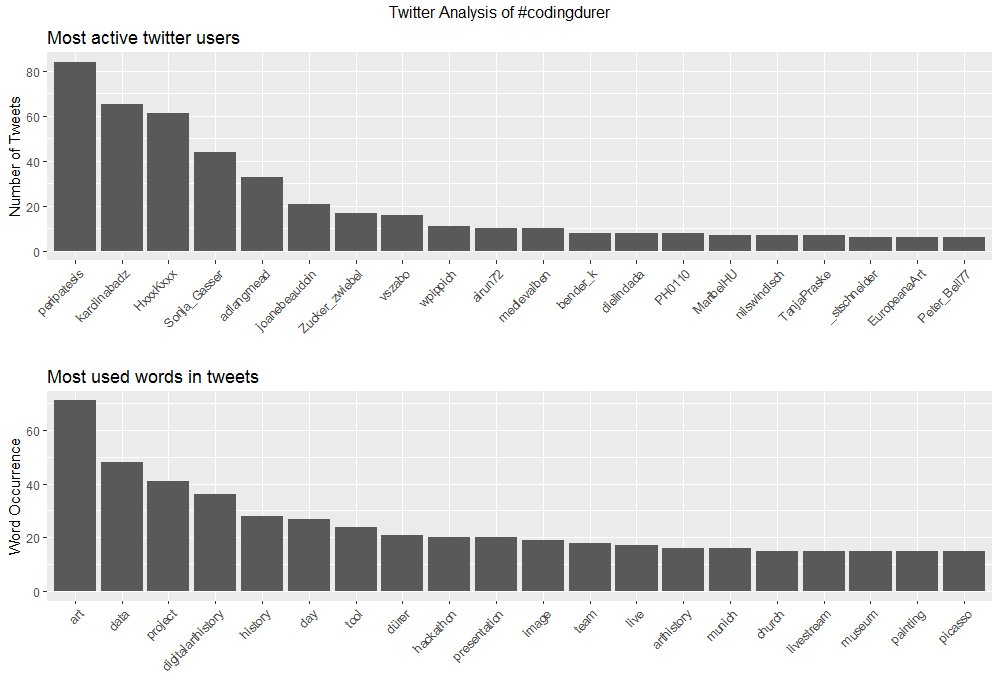
Twitter Analysis of a cultural hackathon
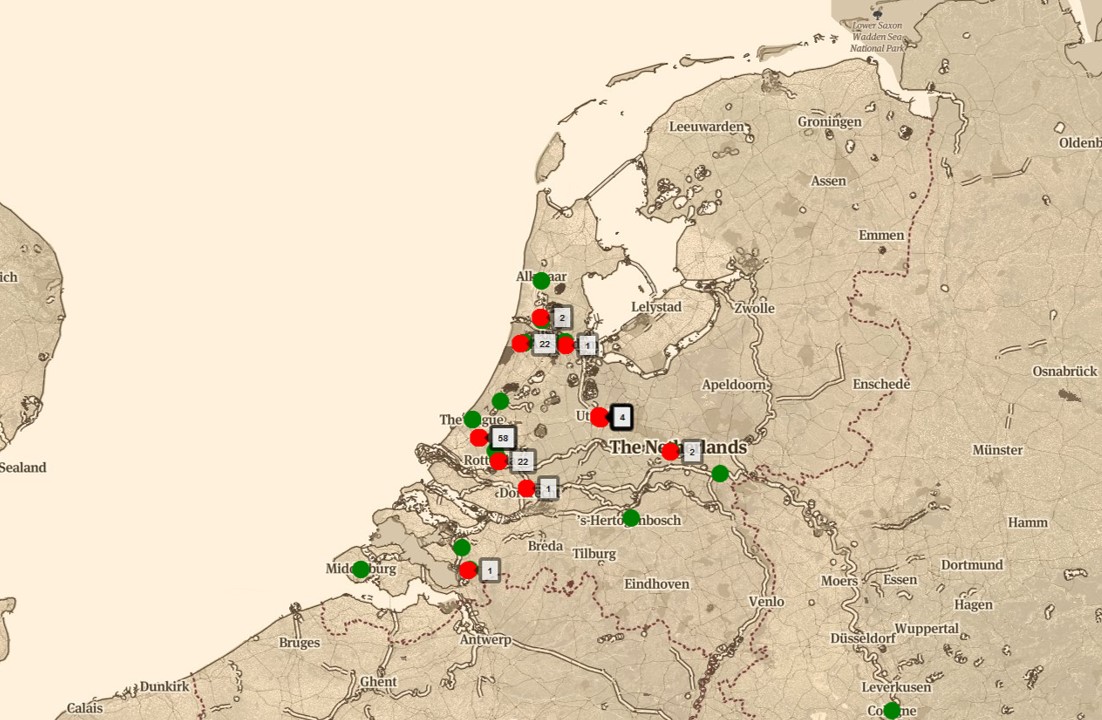
Interactive Map for a cultural hackathon
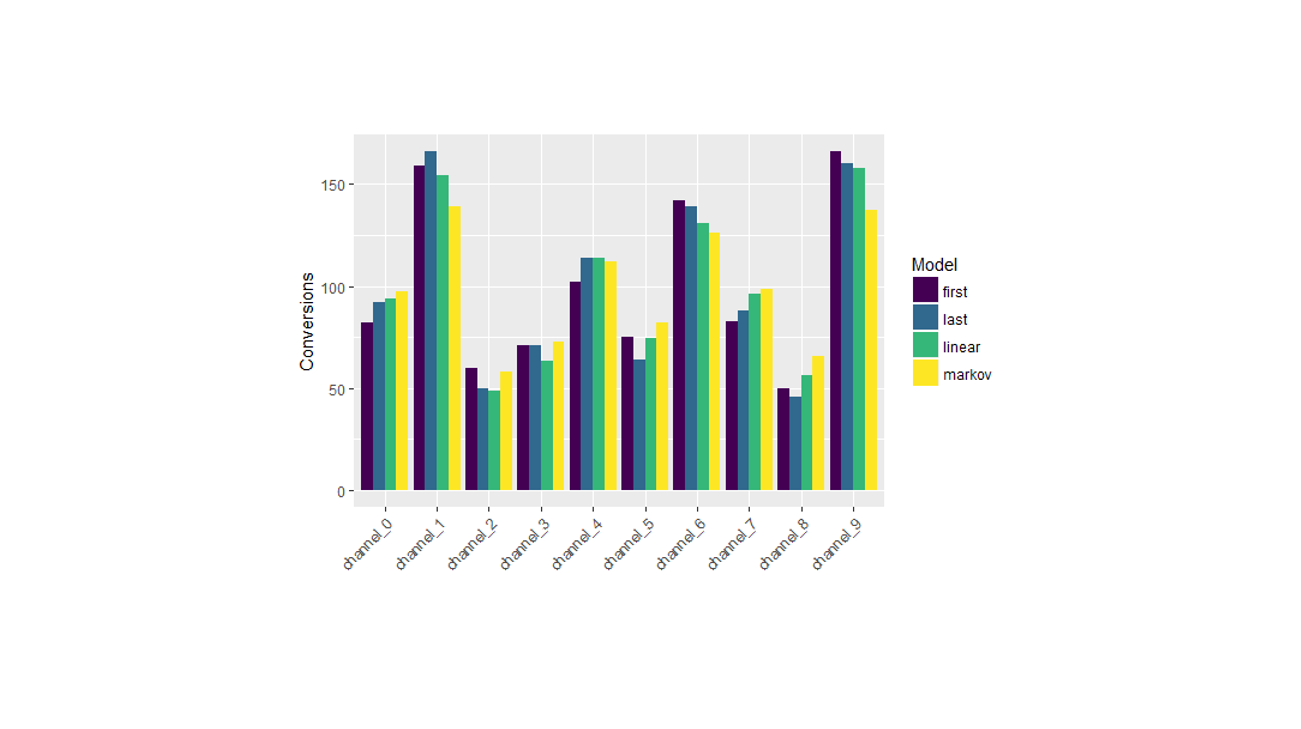
How to set up an algorithmic attribution model?
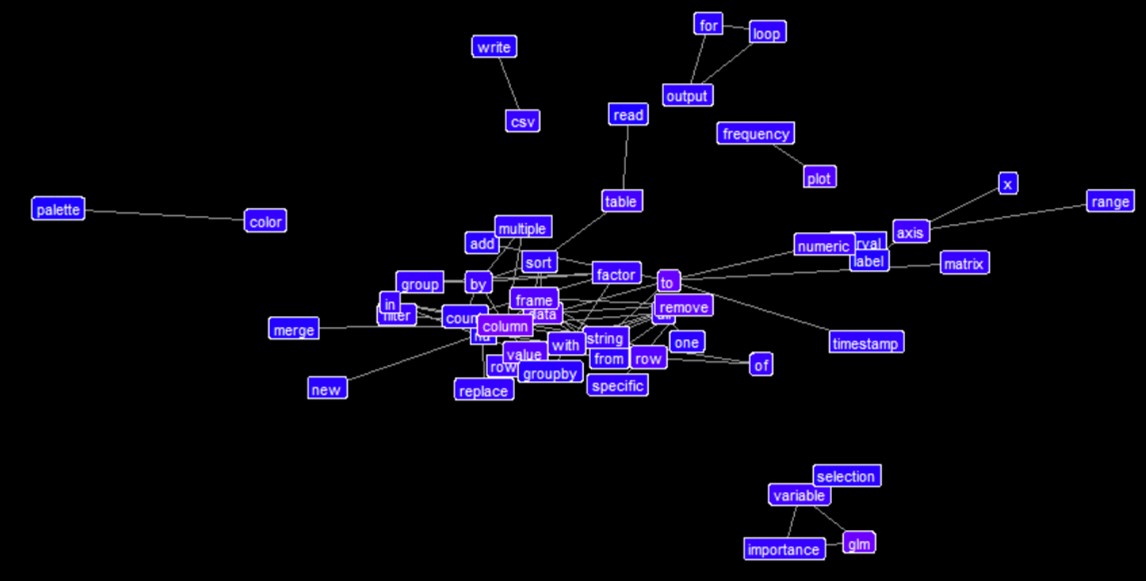
My R-related Google Search History over time

Top 16% Solution to Kaggle’s Product Classification Challenge
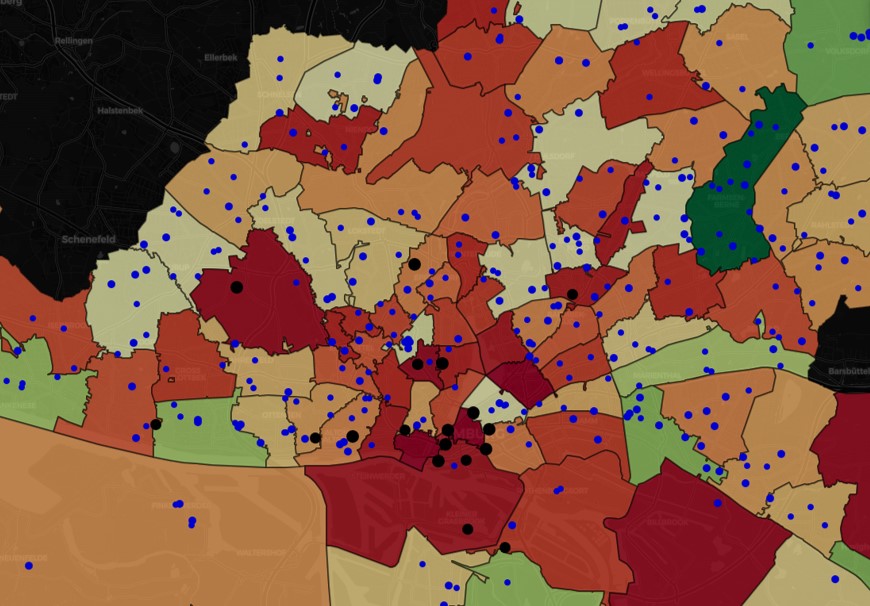
Interactive Map for a cultural hackathon
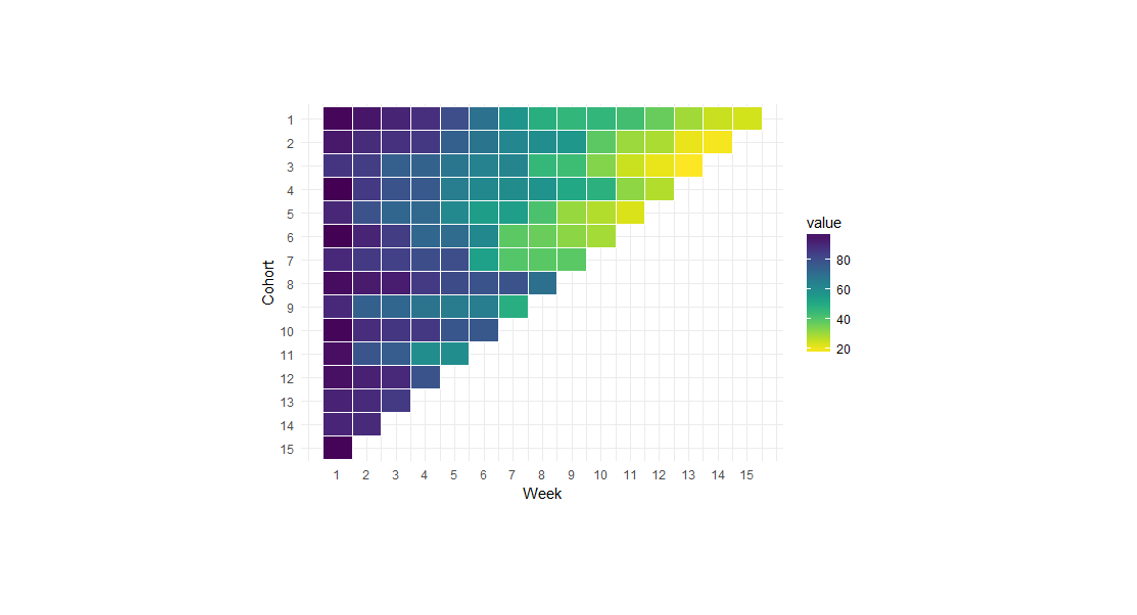
How to use ggplot to create cohorts?