Bird Data Visualizations
In 2024 I took part in Binoculars to Binomials, a course by Jer Thorp for coders interested in cultivating an observational practice — and for birders who want to dive into the data that comes out of their hobby. It sits right at the overlap of environmental care, data, and creativity.
The course pushed me to actually go outside and look at things more carefully. These are three pieces I made during it.
Woodpecker Sound Visualization
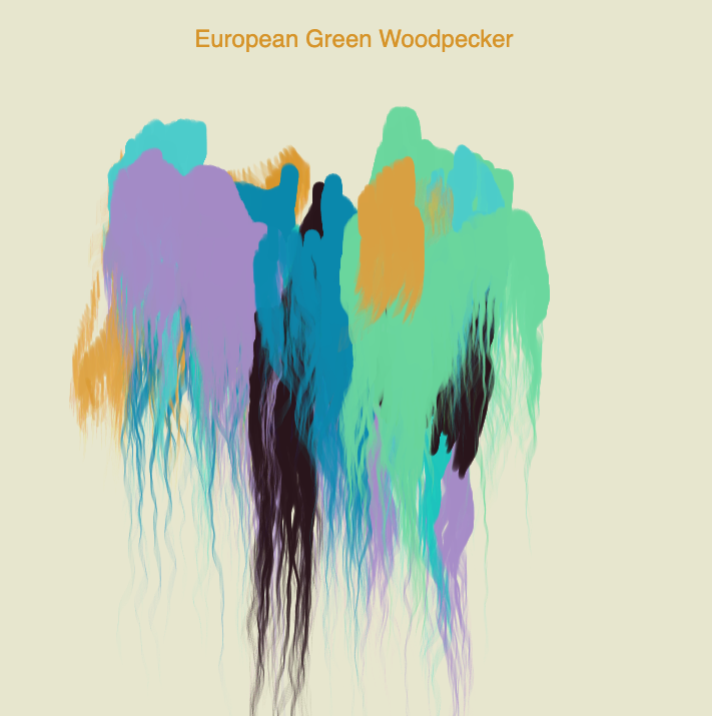
An animation of the sounds of local woodpeckers — each species has a distinct drumming pattern and call. I encoded those rhythms visually, letting the audio structure drive the generative output.
 ↗ Open visualization
Eurasian Oystercatcher — eBird Checklist Submissions
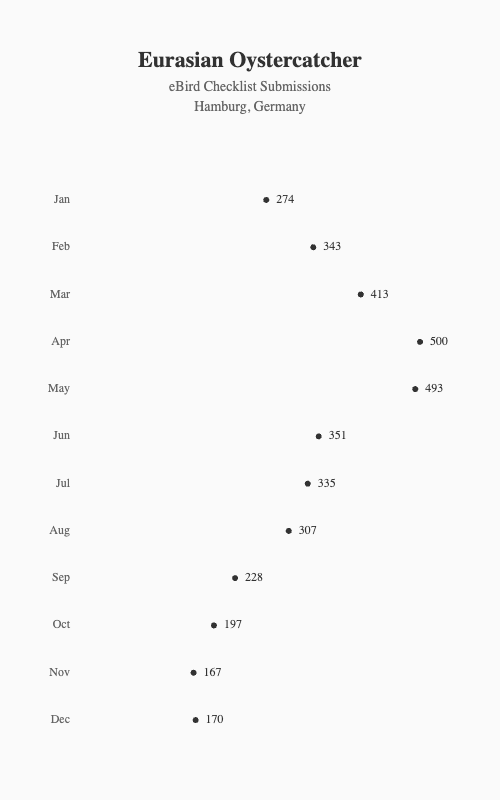
I spotted an Oystercatcher on the Alster one day — a bird I'd never seen in the city before. I assumed it was rare. The eBird data said otherwise: hundreds of checklist submissions per month year-round. Looking closer at the bird, I noticed its right leg was injured, flopping limply with each step. That detail, too, would have escaped me without careful observation.
"It's amazing how rewarding birdwatching can be. The oystercatcher flies out over the Alster lake. My gaze drifts to an elderly lady who has a pigeon perched on her hand and is surrounded by dozens more pigeons and coots. A father asks the woman if she could spare some bird food for his daughter. Among the hungry flock of birds, I spot my potential oystercatcher again."
 ↗ Open visualization
Binoculars to Binomials — Hamburg Bird Count
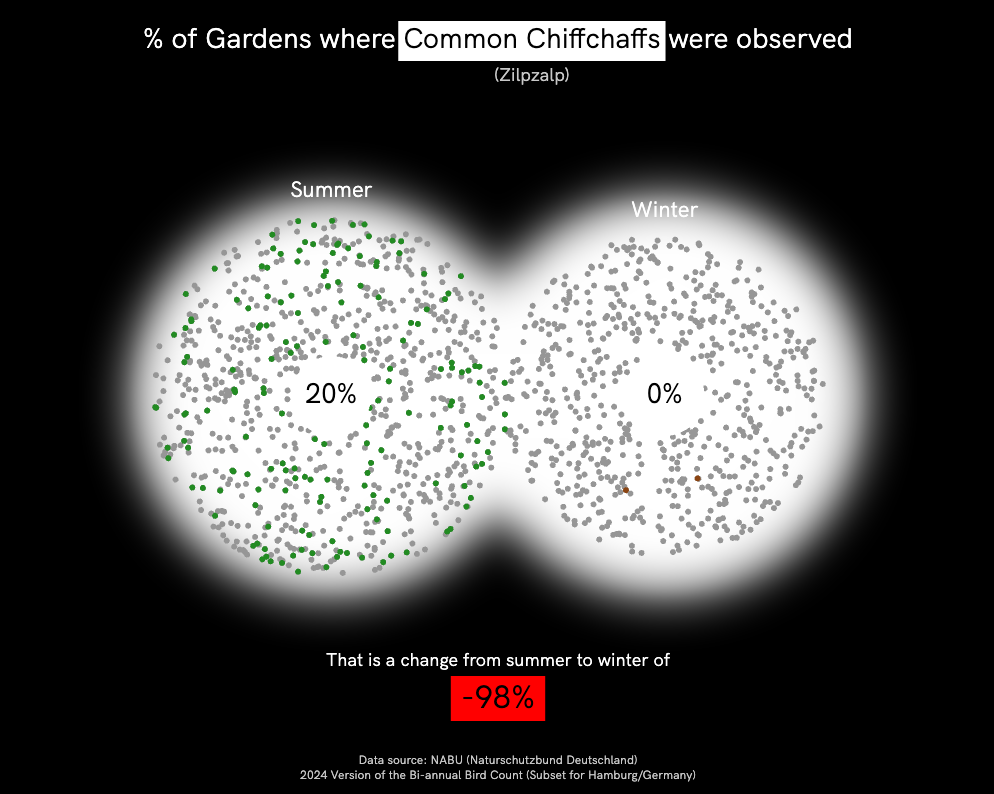
Using data from the NABU bi-annual bird count, with over 130,000 birders participating across Germany in the winter edition. I focused on a Hamburg subset and built a binocular-style visualization comparing which birds are spotted in gardens in summer vs. winter — showing which ones migrate and which ones stay. The Common Chiffchaff drops 98% between seasons.
 ↗ Open visualization