#airrohr
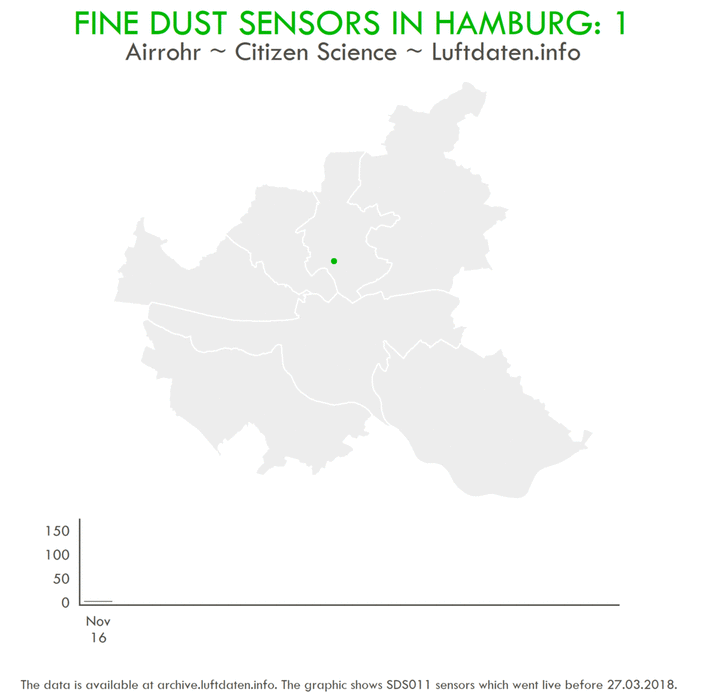
I installed my own open source fine dust sensor on my balcony in September 2017. I build this sensor as part of a bigger citizen science project called luftdaten.info. The data from all fine dust sensors is also available here. By March 2018 I was wondering how many fine dust sensors we have in Hamburg so I created an animated visualization of the project growth in Hamburg. It’s all made with #rstats. The gif is made out of multiple ggplot outputs.
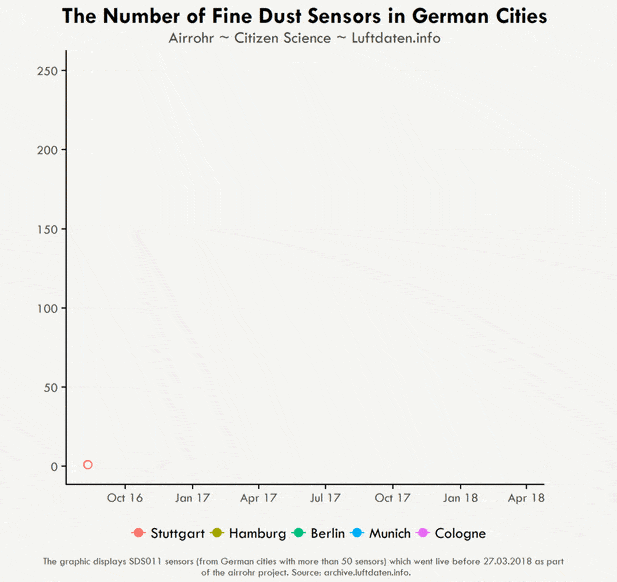
I created another animated visualization to compare the project growth in German cities with more than 50 fine dust sensors. Same thing here, the gif is made out of multiple ggplot outputs.
Both visualization are done with R and you can find the code on my Github.